Category Archives: UI Design

#DIY Captcha

A CAPTCHA (“Completely Automated Public Turing test to tell Computers and Humans Apart”) is a type of challenge-response test that I needed to introduce on my website. Without this test my articles accumulated hundreds of comments per day. All those comments were unrelated to the articles and were posted by automation scripts written by spammers.

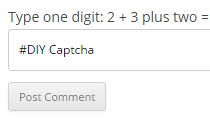
Having software engineering experience I come up with a simplest way to implement an easy to use CAPTCHA to deal with the spam comments. This CAPTCHA is just another text fields that a commenter must fill. Here how it looks:

WordPress — the application that I use to run the readNtry.com website — is a PHP application. It supports some plugins out of the box including one for managing comment spam. Unfortunately I am reluctant enabling plugins that rely on the infrastructure running outside of my server.

I know, this text base test is extremely easy to workaround in the spamming scripts, but this CAPTCHA is effective so far. I guess spammers don’t really care about my website.

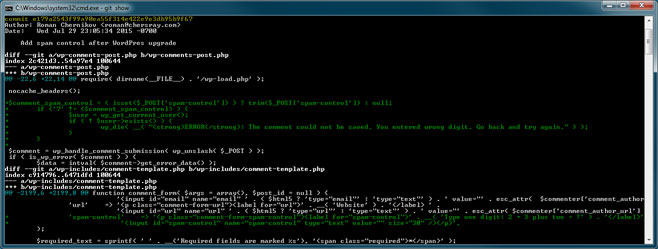
So here is how it works: I modified two PHP files to enable the CAPTCHA functionality: wp-includes/comment-template.php and wp-comments-post.php. There are only about 10 lines of code. I reapply the commit every time WordPress is upgraded to the new version as it overrides my changes. In a rare case when my commit conflicts with the WordPress changes I do quick refactoring to resolve the conflicts. You may download the commit if you are interested to see the changes.

Interesting thing I found about the question. It may take a few tries to pick a good question. When I used this string as a question “2 + 3 = ?” the spamming scripts were able to pass through. I found that the scripts can’t pass the “2 + 3 plus two = ?” test at this time.

With the current progress in artificial intelligence (AI) I guess my captcha is a very short term solution but, well, it works well so far.

Calendar

I would like to share a wall calendar with you, so you could plan your events and mark your activity. I developed a software calendar that can be printed and placed on a wall, a white board or a fridge. Your favorite picture, holidays and events can be added to the calendar. The calendar can be delivered as a PDF attachment to your email every month.

You may download the calendar for November 2016 as a PDF document with one click:

monthly_calendar

This monthly calendar is very flexible. It supports dozens of features such as:
* 10 languages
* Moon phases
* Preview of previous & next months
* Highlighting weekends, holidays and events
* Add your own picture

Table Calendar

Table Calendar

The calendar is designed to fit the standard 8″ x 11.5″ paper but it can be zoomed in or out before printing. When printed with 33% scale the calendar makes a nice table calendar.

To get a copy of the calendar for December 2016, comment on this post with your valid email. Your email will not be shown or shared; I care about privacy.

I am glad to open source this calendar with the most permissive MIT license. I used Microsoft SQL Server Reporting Services (SSRS) to develop the calendar. Technically, the calendar is the SSRS report. Check my SSRS-Calendar project on GitHub.

I hope you will find this calendar useful, as it helps to never miss events, reminds to buy gifts in advance, and allows remembering your activity and happy moments.

Let me know what you think. Thank you!
Roman

Temperature/Humidity Sensor Test

I bought two “Caliber” temperature-humidity sensors a couple of years ago. Both of them read temperature and humidity consistently; they often show exactly the same values. They work great and the batteries last: I have not changed their batteries yet.

Caliber IV and Caliber III Temperature Humidity Sensors

Caliber IV and Caliber III Temperature Humidity Sensors

Since both “Caliber” sensors are from the same company I wanted to double check the numbers using 3-d party sensors. It was easy to accomplish with my Arduino UNO board. I picked four DHT11 (blue) and one DHT22 (white) sensors, connected them to Arduino using a solderless board and wrote a simple program using Arduino IDE to read the values from those sensors and to show temperature and humidity on the connected “2004 20×4 LCD” screen.

arduino_dht22_sensor_test

The DHT11 sensors have +-5% humidity accuracy and +-2°C temperature accuracy. The DHT22 sensor supports wider measurement range and is more accurate; it has +-2% humidity accuracy and +-0.5°C temperature accuracy.

I found that all sensors both DHT11 and DHT22 read the temperature very consistently. The humidity measurement was very consistent between four DHT11 sensors but DHT22 humidity values were different by ~10%. The humidity values from the DHT22 sensor are close to my “Caliber” sensors.

The screen shows pin number, temperature in Celsius and humidity percentage for each sensor. The more accurate DHT22 sensor is connected to the Arduino PIN 6 and uses the whole second row of the screen to show temperature in both Celsius and Fahrenheit. The third and fourth lines of the screen are dedicated for other four sensors that use Aurduino pins: 2, 3, 4, and 5.

temperature_humidity_sensor_test

So I am puzzled. Why am I getting different humidity values from DHT11 and DHT22? It looks like my little project will take more time, as I need to troubleshoot if it is a hardware problem, a bug in the DHT library or an issue in my code.

Hmm, which value is more correct? Reading different sensors at once reminds me a proverb: Do not take two compasses to the sea, only one or three.

Augmented Reality Watch

Wearable computing and augmented reality are merging fast to deliver completely new experience. An Augmented Reality Watch can extend your favorite timepiece. It can add handful of features to a $20 watch. It can make a wrist band ticking.

Augmented Reality Watch

Augmented Reality Watch

The idea of the augmented reality watch concept is to leverage a wearable camera to capture images, to run object recognition algorithms and to show additional information on a wearable display. Software of an augmented reality system can easily recognize simple shapes such as circle, square, line. That is why a wrist watch would be ideal as one of the controlling devices for an augmented reality system. Wrist watches are:

  • Visible when needed. Hidden under a shirt sleeve most of the time;
  • Accessible when both hands are busy;
  • Accessible faster comparing to voice commands.

The challenge is to tune augmented reality algorithms to recognize a particular watch, so the system is not activated with other watches. A trip to London may be surprising if you see calendar reminders being augmented around Big Ben.

The Augmented Reality Watch is still a concept but one day we may find it available. That is why the picture was heavily edited.

Thanks for reading. Try to think about how augmented reality can make your life easier.

Print Ready Report

Print Ready Report

Print Ready Report

Read a print-readiness check-list, apply it during report design and avoid various printing problems. Try it with SSRS, Excel, Word, Visio, BIRT, JasperReports, and any other manual or automated reporting tool.

Have you ever printed a one page document with unexpected empty second page coming from your printer? Have you seen how the report binding makes documents unreadable? Have you seen a great report with no way to know when the data was gathered? Read further and you will never experience these printing problems again.

Following the rules and suggestions below will make your reports looking good on paper, save you toner and paper, make it easier to print, and make your boss a little happier.

  • Set report orientation. Otherwise report consumers will lose time and tons of paper;
  • Set the standard page size to avoid unnecessary automatic resizing;
  • Make sure a printed copy of the report contains:
    1. Date and time when report was generated. Include full four-digit year.
    2. Contact info of report author or publisher: name, URL, email or phone number;
  • If report contains colors print on black and white printer and check shades of gray are distinctive;
  • Keep reports bindable:
    1. Design margins so the report content is fully visible when report is bound horizontally or vertically;
    2. If a report is usually printed on both sides of paper make all margins the same width. Otherwise consider making right or bottom margins narrow to use more space for the report content;
    3. Make top and right margins wider If users may leave notes on the report.
    4. Keep report layout size 0.1 inch smaller than the page size minus margins. This is to avoid empty sheets of paper coming from the printer every time you print the report;
  • Include page number if the report is longer than two-three pages;
  • Consider including total page numbers such as “1 out of 15”;
  • Table reports:
    1. Show table header on every page;
    2. Avoid showing table footer without details on a separate page. Include a line or two of data from the previous page (along with the table header) and add the totals of the table footer;
  • Always use report covers or binders when you share printed reports with your clients, bosses and colleagues. Research available options: from cheap sliding bar report covers to more expensive hardcover and coil binders.

Thank you for reading this post. Try using this checklist during your report design.

Traceability Matrix

Traceability Matrix

Traceability Matrix

Traceability matrix visualizes complex relationships between multiple entities. In this post I will describe traceability matrix and traceability table with graphical examples. Traceability matrix entities can be of one, two or more different types. For example, traceability matrix that shows direct flights between different cities has nodes of the same type (cities). In contrast, the requirements traceability matrix (RTM) helps to trace relationships between two types of entities: requirements and tests.

Complex relationships can be visualized using matrix or table formats. The matrix format allows tracing relationships in bi-directional way, but if the number of nodes is big enough the matrix may be difficult to use or print as it often grows exponentially. The matrix cells show both: existence of relation and lack of it.

A traceability matrix report can use less space and still be useful if there is a way to group nodes. Using the flight matrix example, it may not be practical to visualize the matrix of direct flights between hundreds of cities, but it may be useful to analyze the matrix when cities are grouped by a state or a region. When the nodes are grouped together the matrix cells contain a number that represents the relation count. The example below is a requirements traceability matrix report where requirements and tests are grouped by folders in a test management system:

Requirements Traceability Matrix report

Requirements Traceability Matrix

Traceability table helps to track relationships in one direction only. It uses less space as it doesn’t need to show lack of relations. Additionally the table format allows tracing relationship between three or more types of entities; a good example is a requirements traceability table (RTT) report to trace relationships between requirements, tests and defects:

Traceability Table

Traceability Table

Below is a traceability matrix example that visualizes data from one of my previous projects. This matrix shows defect priority/severity distributions and allows finding anomalies such a blocker defect with the lowest priority. I put the lightning on top of the screenshot to highlight the distribution pattern. From the report design point of view notice that the ‘total’ columns show both percentage and absolute values; pale colors don’t obstruct readability.

Traceability Matrix

Traceability Matrix

Summary: traceability matrix is a very powerful tool. It is commonly used to analyze relationships, connections and associations. It is easy for human brain to find patterns in the data arranged in a matrix layout. The real power of traceability matrix compared to tables is in its two dimensional nature. Look for OLAP cubes if you need even more reporting power.

Thank you for reading this post. Try to fit your data in the traceability matrix layout and see if you find some interesting patterns.

Mouse-Click-less Design

We all know inconvenience of working with applications that require too many mouse clicks to perform simple actions. With the mouse-clickless design tedious actions can be eliminated. In this post I would like to stress the idea of designing GUI that requires as few mouse clicks as possible. As an example I will describe a simple mouse-clickless application “Measurement Table” I have designed more than 10 years ago.

The Measurement Table application allows converting length, weight, and temperature values between US Customary Units and Metric System without unnecessary mouse clicks. The idea of this unique design is to avoid mouse clicks by eliminating two actions: selecting “From” and “To” metrics. This application converts provided value to multiple conversion paths at once.

Measurement Table
There are many existing applications on the market to convert measurement values, but most of them lack the mouse-clickless design, forcing users to do unnecessary clicking. A generic conversion application consists from the input form, two dropdowns and the “convert” button:

Generic Measurement Conversion Application
In order to convert a value at least four or five clicks are required to select correct values in the drop-downs.

Here is a story that keeps my attention to mouse clickieness: when I was a student my computer mouse broke. This was a very bad news for my Windows 3.11 desktop and my student budget. I was forced to use Windows without a mouse for the whole month! I’ve learned all the Windows short-keys and used a mouse emulator for actions without short-cuts. Working without a mouse made it obvious that some mouse clicks were not necessary and sometimes inconvenient in most workflows.

Summary: Evaluate your GUI design and pay attention to number of mouse clicks. Now I would like to share my “Measurement Table” mouse clickless software with you. Feel free to bookmark this URL: https://www.readntry.com/mtable.htm  Please note that even though this simple app features unique design it lacks some validation. For example, it may try to convert impossible values such as -300 degree Celsius.

Thanks for reading this post. Now try eliminating unnecessary mouse clicks from your application!