
A traceability matrix visualizes complex relationships between multiple entities. In this post, I will describe the traceability matrix and traceability table with graphical examples. Traceability matrix entities can be of one, two, or more different types. For example, a traceability matrix that shows direct flights between different cities has nodes of the same type (cities). In contrast, the requirements traceability matrix (RTM) helps to trace relationships between two types of entities: requirements and tests.
Complex relationships can be visualized using matrix or table formats. The matrix format allows tracing relationships in bi-directional way, but if the number of nodes is big enough the matrix may be difficult to use or print as it often grows exponentially. The matrix cells show both: the existence of relation and the lack of it.
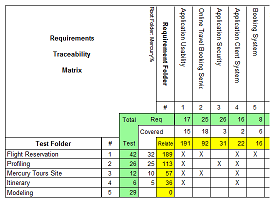
A traceability matrix report can use less space and still be useful if there is a way to group nodes. Using the flight matrix example, it may not be practical to visualize the matrix of direct flights between hundreds of cities, but it may be useful to analyze the matrix when cities are grouped by a state or a region. When the nodes are grouped together the matrix cells contain a number that represents the relation count. The example below is a requirements traceability matrix report where requirements and tests are grouped by folders in a test management system:
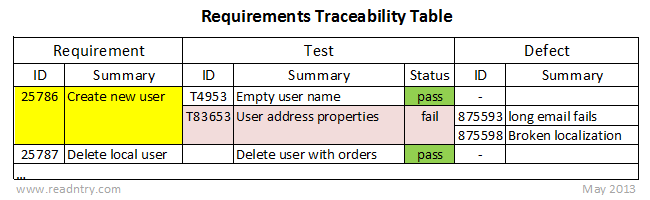
A traceability table helps to track relationships in one direction only. It uses less space as it doesn’t need to show a lack of relations. Additionally, the table format allows tracing relationships between three or more types of entities; a good example is a requirements traceability table (RTT) report to trace relationships between requirements, tests, and defects:
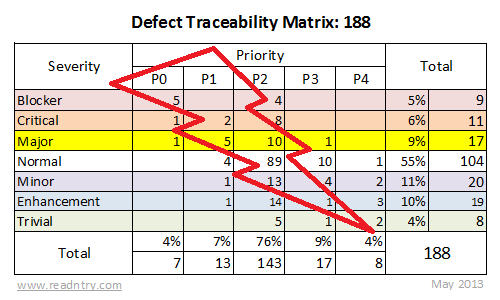
Below is a traceability matrix example that visualizes data from one of my previous projects. This matrix shows defect priority/severity distributions and allows finding anomalies such as a blocker defect with the lowest priority. I put the lightning on top of the screenshot to highlight the distribution pattern. From the report design point of view notice that the ‘total’ columns show both percentage and absolute values; pale colors don’t obstruct readability.
Summary: the traceability matrix is a very powerful tool. It is commonly used to analyze relationships, connections, and associations. It is easy for a human brain to find patterns in the data arranged in a matrix layout. The real power of the traceability matrix compared to tables is in its two-dimensional nature. Look for OLAP cubes if you need even more reporting power.
I hope reading this post was useful. Try to fit your data in the traceability matrix layout and see if you find some interesting patterns.